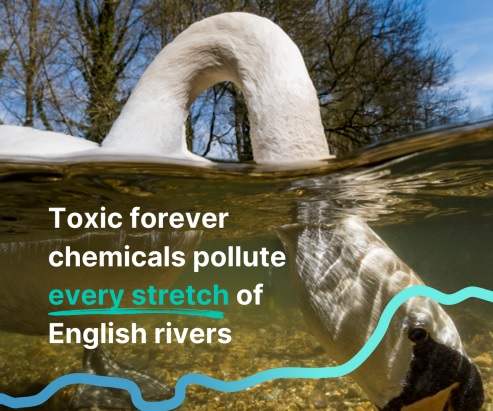
Even the clearest looking waters can contain microplastics, industrial chemicals, hydrocarbons, fertilizers and pesticides, and even pharmaceuticals. Untreated sewage spills blight most of our rivers, and even treated wastewater still contains a cocktail of chemicals like pharmaceuticals, pesticides from veterinary flea treatments, nutrients and household cleaning products when it is returned to our waterways, notes ‘The state of the rivers’ report.
Getting a clear picture of the state of our rivers is not a simple task – and the issues lie in the availability of data. Across the UK and Ireland, the regulators in each nation monitor water quality and river health in different ways and at different times, making clear-cut comparisons or broad conclusions hard to draw.
However, three things are certain:
- Our rivers are not healthy – far from it.
- Things haven’t improved since our last report in 2021.
- More data is needed to truly understand the scale of the problems and deploy solutions.
In England, water chemistry, along with a range of other health measures, is assessed by the Environment Agency in accordance with the Water Framework Directive (WFD) – legislation introduced and still in force from when we were members of the European Union. Rivers are divided into many shorter stretches (known as river waterbodies) so that we can see how the health of a river changes along its length. Often the headwaters of a river are healthier than the stretches downstream, as the river gets polluted by different activities as it travels downstream, through its catchment.
Under the WFD, river health can be measured under two main categories which are combined to give ‘overall status’: chemical and ecological status.
Chemical health considers the presence (or absence) of a list of chemical pollutants using water sampling.
Ecological health looks more broadly at what’s living in the river, and how modified it is. The presence, absence and abundance of species is a good indication of the general health of a river.
We know healthy rivers are vital - yet the latest health assessments show that still none of England’s river stretches are in good or high overall health:
- 0% are in good overall status;
- 0% are in high overall status;
- 23% are classed as in poor or bad overall status;
- 85% of river stretches fall below good ecological standards; only 15% achieve good or above ecological health status.
England’s WFD data is published every three years, and the most recent results don’t paint a positive picture. Very little has changed – let alone improved – since the last data from 2019. Of the 3553 river stretches we have data for, just 151, stretches of river got better and moved up an ecological standard, and 158 actually got worse. Worryingly, river sampling has also decreased, with nearly 6% fewer river stretches receiving health classifications compared to 2019.
Sectors impacting river health and causing failure in England's river stretches (data from Environment Agency, 2022):
- 62% of river stretches failed because of activities attributed to agriculture & rural land management (pollution from fertiliser or livestock);
- 54% of river stretches failed because of activities attributed to the water industry (including treated and untreated sewage discharge, and abstraction of groundwater);
- 26% of river stretches failed because of activities attributed to the urban and transport sector (such as urbanisation and transport pollutants);
- 39% of river stretches have a failure for which the sector is under investigation (is not known).
read more in our Telegram-channel https://t.me/The_International_Affairs

 8:54 13.04.2024 •


